9 Full Scale Sea Trials
Once a ship has been designed and built, before handing over the ship to the owner, the ship builder would like to establish the maneuvering characteristics of the real vessel. Typically these trials are conducted in protected waters near the coast. Full scale maneuvering tests are not only used to determine the hydrodynamic characteristics of the real vessel but also to check whether owner’s design specifications have been met. The maneuvering characteristics are also a part of the contractual obligation of the shipyard and need to be satisfied before the vessel can be delivered. For sea trials, International Towing Tank Conference (ITTC) has recommeded the following maneuvers:
- Turning circle maneuver
- Zig-zag maneuver
- Spiral maneuver
- Reverse spiral maneuver
- Pull out maneuver
- Parallel shift maneuver
9.1 Turning Circle Maneuver
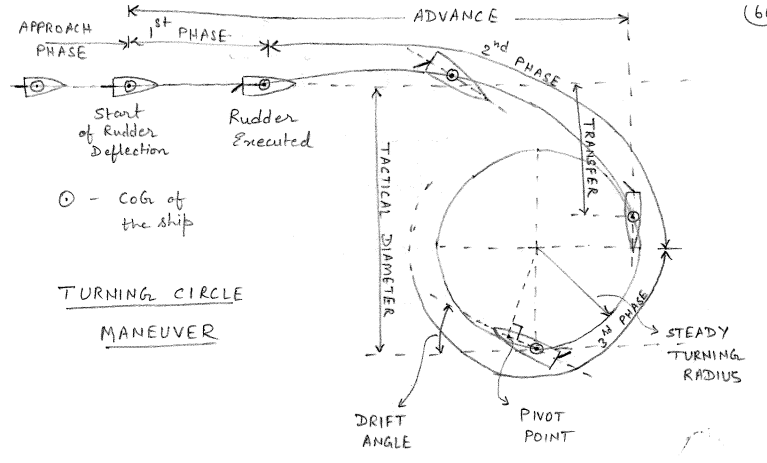
This maneuver has already been described in detail in Chapter 6. The vessel is first allowed to reach design speed. Once the vessel has reached the design speed and is going on a straight line, a hard rudder is applied. Under the effect of the rudder, the vessel goes through the three phases of turning and settles onto a steady turn as shown in Figure 9.1. The quantities of interest that are measured in this test include:
- Tactical diameter
- Advance
- Transfer
- Drift angle \(\beta\)
- Heel angle
- Speed loss
9.2 Zig-zag Maneuver
This test too commences once the ship is moving steadily forward with design speed \(U\) in a straight line. In a zig-zag maneuver, the rudder is set to some chosen \(\delta_0\) as quickly and as smoothly as possible. The rudder is held at this angle \(\delta_0\) until the heading reaches a specified value \(\psi_0\). When the heading reaches \(\psi_0\), the rudder is set to \(-\delta_0\) as fast and as smoothly as possible. Now the rudder is held at \(-\delta_0\) until the vessel heading reaches \(-\psi_0\). This process is repeated for multiple cycles (typically 5 rudder step responses).
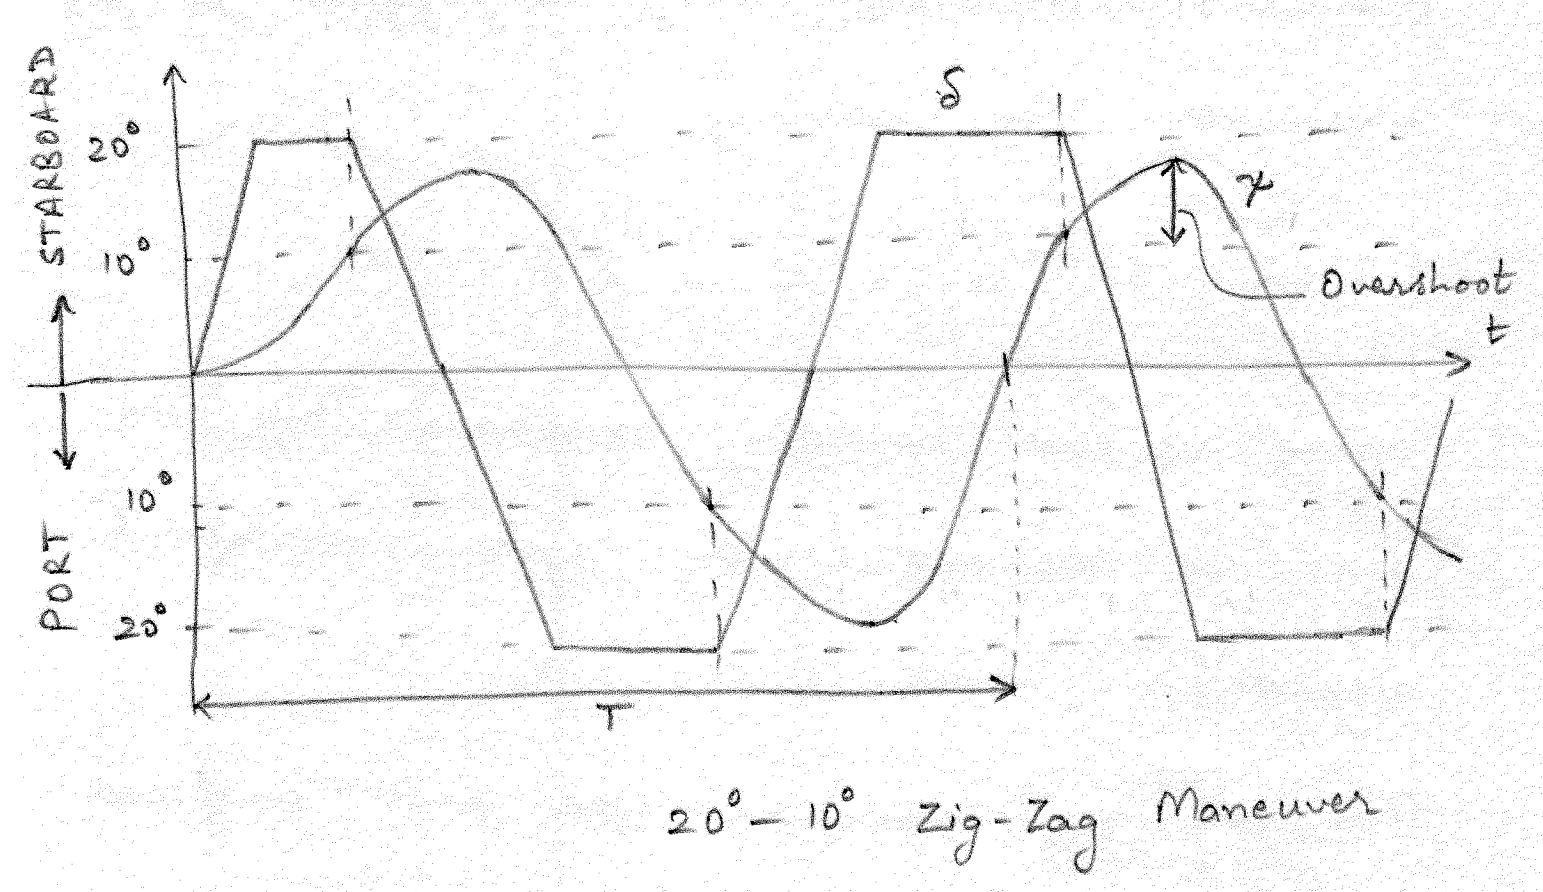
When \(\delta_0 = 20^{\circ}\) and \(\psi_0 = 10^{\circ}\), this maneuver is called \(20^{\circ}\)-\(10^{\circ}\) zig-zag maneuver. Note that the first angle denotes the magnitude of rudder angle to be applied while the second angle denotes the angle that the heading must reach before the rudder is reversed. The time history of rudder angle \(\delta(t)\) and heading angle \(\psi(t)\) is shown in Figure 9.2.
ITTC standardized the \(20^{\circ}\)-\(20^{\circ}\) zig-zag maneuver for ships in 1963. For larger ships, ITTC recommends \(20^{\circ}\)-\(10^{\circ}\) or \(10^{\circ}\)-\(10^{\circ}\) zig-zag menuvers to reduce the space and time required to complete the maneuvers. For course unstable ships, zig-zag maneuvers at small angles like \(5^{\circ}\)-\(5^{\circ}\) tend to diverge. In such cases it is recommended to use modified zig-zag tests with \(\psi_0 < \delta_0\) (for example \(5^{\circ}\)-\(2^{\circ}\) or \(10^{\circ}\)-\(1^{\circ}\)).
Quantities of interest in a zig-zag maneuver include:
- Overshoot
- Time to overshoot
- Period of heading
Zig-zag maneuvers can be useful to compare maneuvering characteristics of different vessels. Using the motions measured in this test, the non-dimensional Nomoto parameters \(T'\) and \(K'\) can be estimated by solving the non-dimensional Nomoto equation \(\eqref{eq-nomoto-nd-1}\) with the control input \(\delta(t)\) used in the zig-zag maneuver. These parameters can also be estimated by system identification techniques, where \(T'\) and \(K'\) are estimated by regression techniques.
\[\begin{align} T' \dot{r}' + r' = K' \delta \label{eq-nomoto-nd-1} \end{align}\]
The zig-zag maneuvers were first proposed by the German scientist Günther Kempf in 1932. Therefore it is also referred to as Kempf’s zig-zag maneuver in some texts.
9.3 Spiral Maneuver
In this test, the steady turning rate \(r\) corresponding to a specified rudder angle \(\delta\) is measured. A steady state \(r\)-\(\delta\) curve is obtained by repeating the test for multiple rudder angles. The ship is initially on a straight line course when the maximum possible rudder angle is applied. The steady turning rate \(r\) for this \(\delta\) is obtained. Then progressively the rudder angle is decreased in some discrete steps and the steady turning rate at each discrete \(\delta\) is recorded. This process continues until \(\delta\) reaches the maximum possible rudder angle in the opposite direction to the initial rudder applied. The results are plotted on a \(r\)-\(\delta\) graph. The \(r\) vs \(\delta\) curve for straight line stable and unstable ships are shown in Figure 9.3.
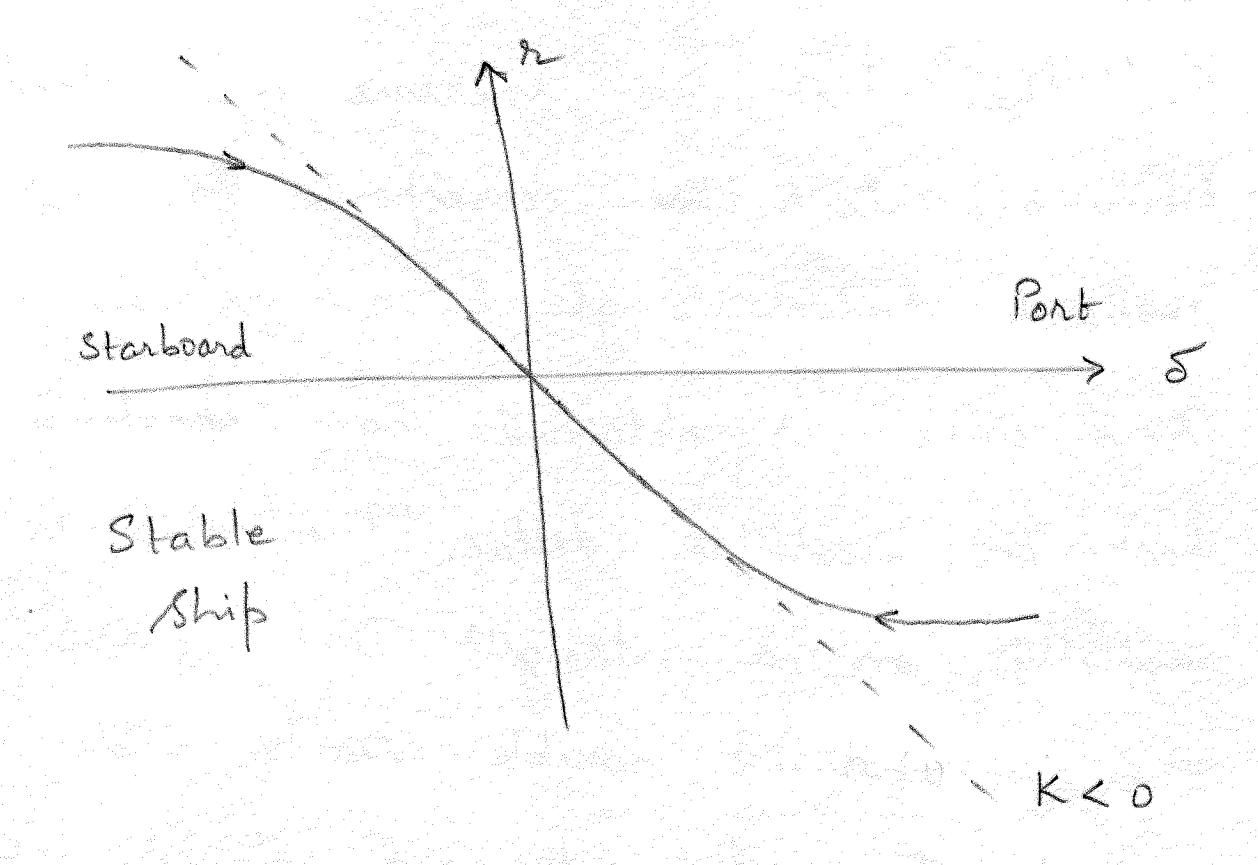
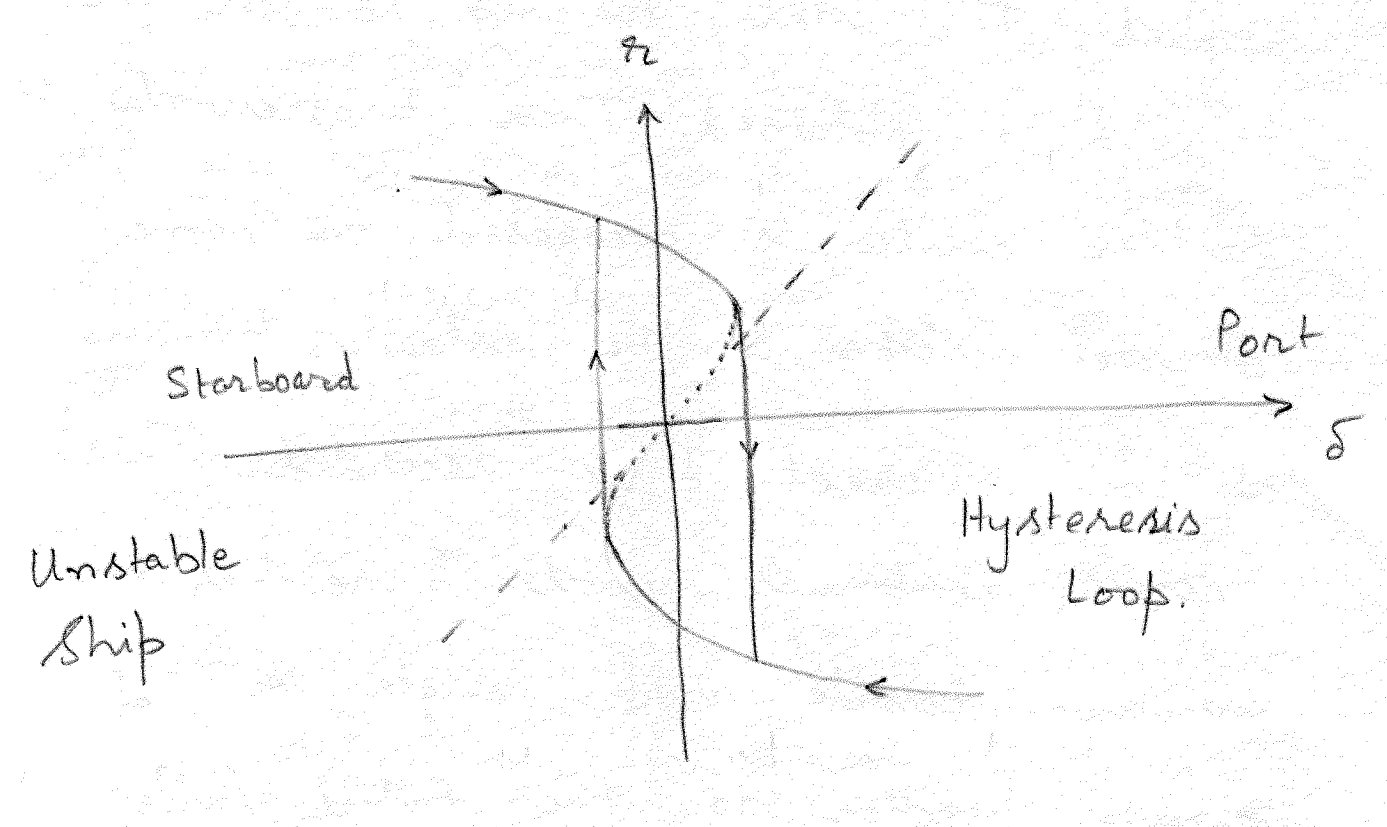
The deviation of the curve from straight line in Figure 9.3 (a) shows the effect of non-linearities at larger rudder angles. For an unstable ship scenario shown in Figure 9.3 (b), when approaching from a port side hard rudder to zero rudder the turning rate continues to be negative when the rudder angle reaches zero. In such cases, even when a small starboard rudder is applied and held steadily, the vessel continues to turn towards the port side. When the rudder is increased further in the starboard direction, the vessel exhibits a jump and suddenly shows steady starboard turning rate. A similar behavior is observed when the rudder is decreased in steps from a hard starboard rudder angle. For an unstable ship, the spiral maneuver does not yield the unstable steady yaw rate (depicted as a dotted line in Figure 9.3 (b)) corresponding to small rudder angles.
The spiral maneuver was proposed by the French scientist Jean Dieudonné in 1949-50. Therefore this maneuver is sometimes referred to as the Dieudonné spiral maneuver. With the introduction of the reverse spiral (introduced in the next section), Dieudonné spiral is also sometimes referred to as the direct spiral maneuver.
9.4 Reverse Spiral Maneuver
The reverse spiral maneuver was first proposed by Mogens Bech in 1966. In this test, the required rudder angle \(\delta\) to achieve a specified yaw rate \(r\) is measured. Note that in this test, the required rudder angle \(\delta\) is obtained by taking a time average of the applied rudder over the period when the vessel’s turning rate is maintained constant. This allows the unstable region of the \(r\) vs \(\delta\) curve to be measured for a straight line unstable ship. Bech suggested that for an straight line unstable ship, the mean value of the required rudder deflection \(\bar{\delta}\) to steer the ship at a constant \(r\) can be described by a nonlinear function \(H(r)\) as shown below
\[\begin{align} \bar{\delta} = H(r) \end{align}\]
For the unstable ship, the modified Nomoto’s second order model can be formulated as
\[\begin{align} T_1T_2 \ddot{r} + (T_1 +T_2) \dot{r} + KH(r) = K(\delta + T_3 \dot{\delta}) \end{align}\]
where the linear term \(r\) has been replaced by \(KH(r)\). This definition implies that the \(\delta\) vs \(r\) curve will be single valued function (one-to-one function) of \(r\) for both stable and unstable ships.
9.5 Pull-out Maneuver
This maneuver was proposed by Roy Burcher in 1969. This maneuver involves a pair of maneuvers in which a rudder angle of approximately \(20^{\circ}\) is applied and returned to \(0^{\circ}\) after the vessel reaches a steady turn. The test measures the dynamic turning rate \(r\).
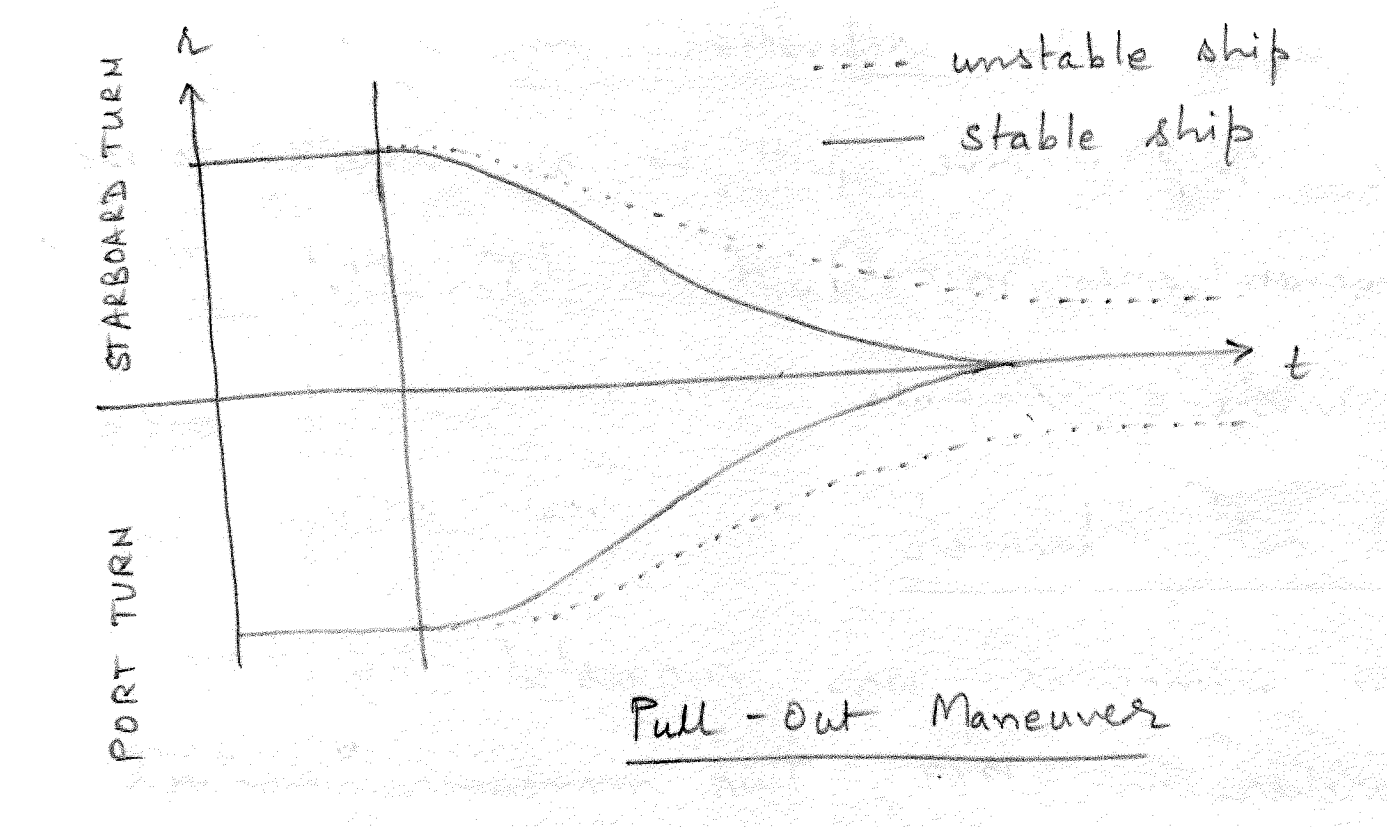
If the vessel is straight line stable, \(r\) will decay to zero for both port and starboard pull-out maneuvers as seen in Figure 9.4. For an unstable vessel, the steady turn rate after the rudder is returned to zero for port and starboard pull-out maneuvers will differ as seen in Figure 9.4. The difference between the steady state turn rates (port pull-out and starboard pull-out) will correspond exactly to the height of the Dieudonné spiral at \(\delta=0\).
9.6 Parallel Shift Maneuver
In this test, the ship is steered to a new course parallel to the original course as fast as possible. This test can be used to estimate the frequency response characteristics for low frequency control inputs.